Production Debugging a Memory Leak
I wrote before about not believing in regular system reboots. One of the services we wrote had a serious memory leak and process size grew over 1GB within 2 days requiring us to perform regular service restarts. This is not something that we were able to replicate in development or QA environment so I’ve decided to do some production debugging.
I love reading the blog of Tess Ferrandez on low level .NET Debugging. http://blogs.msdn.com/tess. The has a series walk trough sessions one of them is on Memory Leaks http://blogs.msdn.com/tess/archive/2008/03/25/net-debugging-demos-lab-7-memory-leak.aspx
I can’t really provide the original code for our service, but I was able to replicate the basic leak in a sample app, and below are steps to find out what it is.
Sample (on skydrive.live.com)
Sample Setup: Open LeakyCache.zip Compile it if you want, or just run the included executable. Click “Leak” to leak memory.

- Download Debugging Tools for Windows form Microsoft and install it on the server that is running the problem application.
- Copy SOS.DLL from “C:\Windows\Microsoft.NET\Framework\v2.0.50727” to “c:\Program Files\Debugging Tools for Windows (x86)” to get access to debugging library for .NET 2.0
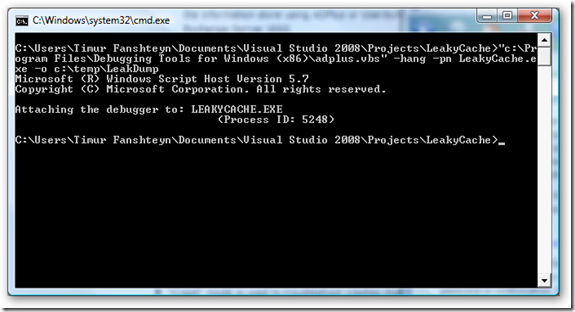
- Execute ADScript to take a memory dump of the LeakyCache application
"c:\Program Files\Debugging Tools for Windows (x86)\adplus.vbs" -hang -pn LeakyCache.exe -o c:\temp\LeakDump
- Start WinDbg
"c:\Program Files\Debugging Tools for Windows (x86)"\windbg - From the File Menu, select “Open Dump File” and open the created dump file from C:\temp\LeakDump\
- Load SOS debugging using command
.load SOS
Now the fun begins :)
- Run !dumpheap –stat
What you’ll see is that the most memory is used by data type is System.String (53MB) and Dictionary+Entry (22MB). Also notice that there are more then 1 million string entries. Most of them are very small (<55 bytes average). - To see the entries. Use command (Press CTRL+BREAK to stop the flow) to see the list of addresses.
!dumpheap -type System.String -max 100
!do 022b8978
Substitute the address of one of the items instead of the 022b8978
I underlines a Text String that you can see. In my experience of debugging my apps, based on the data, I can tell what is stored, and probably have some ideas about where that data is generated or should it be cleaned. - Run !gcroot [Reference] to see exactly what class is holding a reference to the object

A walkthrough like this will not necessary solve a problem in the application, but it can point out to a possible issue in the application that can be solved. To me, a memory leak is not a problem that should be ignored, but is a bug that can be fixed.
Note: Huge thanks to Tess for the wonderful blog http://blogs.msdn.com/tess


